
Strategy Update: We Extended Duration in Client UST Holdings, Hold to our Equity and Liquid Alt Overweights
Genevieve Signoret
(Hay una versión en español de este artículo aquí.)
Fixed Income: Extended average duration
Because we see inflation still trending down and unlikely to resurge and think that the Fed, though reluctant to cut rates, is done hiking them; and because we expect the Fed to begin to taper off and eventually end its quantitative tightening program, we now see it likely that long-term rates have peaked.
We think long-term rates have peaked
Yield on a 10-year U.S. Treasury note (% per annum)
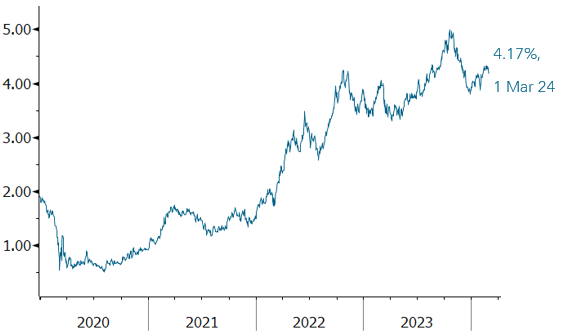
Source: Bloomberg.
Hence, we’ve taken a first step toward extending the average duration of our client U.S. Treasury bond holdings, moving to 9.7 years from a previous 7.3 years.
We’ve taken a first step in extending the average duration of our client long-term U.S. Treasury holdings
Average duration of the long-term U.S. Treasury bond holdings in portfolios we manage, now versus earlier (years)
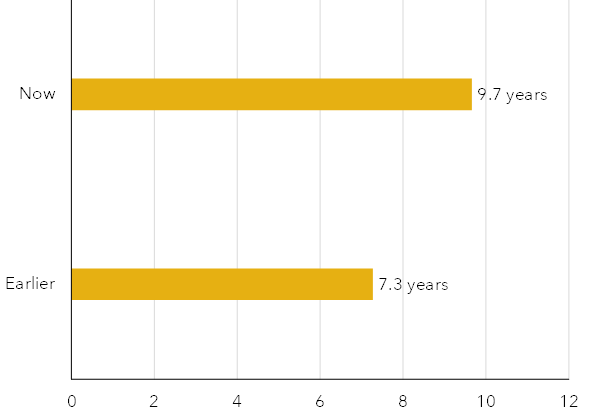
Source: TransEconomics.
We intend to continue extending duration if and when we become persuaded that rates are on a sustained downward trend.
Our small allocations to long-term U.S. Treasury holdings, recall, function in our portfolios as an insurance policies against a bout of market panic such as the one seen last February 2020.
Small allocations to long-term USTs can serve as insurance against market panics, during which they tend to spike. In February 2020, for example, they rose 7% while the stock market took a 9% dive, thus limiting portfolio losses.
S&P 500 Index and iShares +20 years Treasury Bond ETF during February 2020 (Indices, 100 = 1 February 2020)
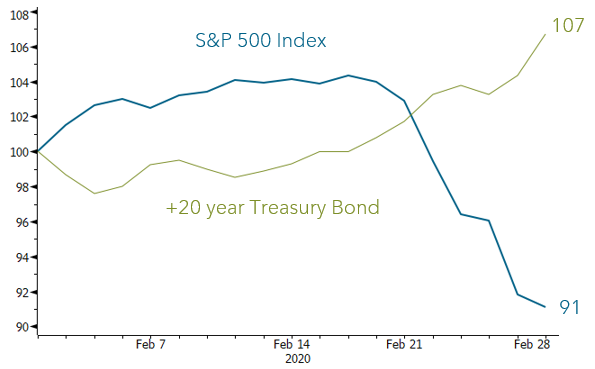
Source: Bloomberg.
Equity: No change
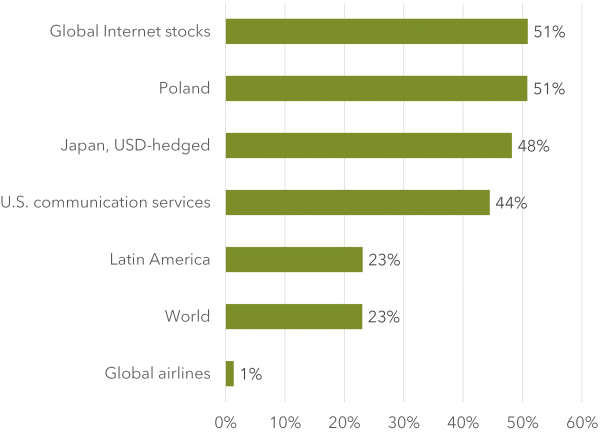
In equity, we continue to overweight the same six equity asset subclasses as earlier, chosen for their attractive valuations and upward price momentum. We show these subclasses below together with the whole world stock market, in the top chart in order of 12-month returns, and in the bottom one in order of three-month returns.
Our core equity holding is the whole world stock market, and we currently overweight six subclasses here ranked in the top chart by order of 12-month performance, and in the bottom chart in order of 3-month performance
12-month total return
3-month total return
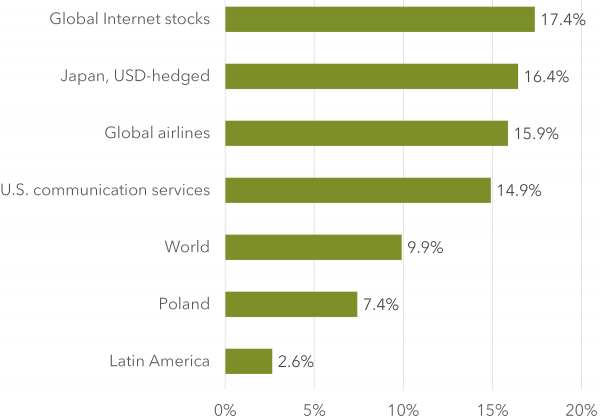
Source: Bloomberg. We use the returns of representative ETFs as proxies for subclass performance.
Our overweights are positively but imperfectly correlated pairwise and with the global stock market.
When a correlation coefficient for two asset subclasses is positive but less than 1, you know that, although they do tend to move up and down together, their co-movement is not perfectly linear. By combining imperfectly correlated equity subclasses, we can lower the portfolio’s volatility—or “risk”, in finance lingo.
Below we show you that our equity subclass selection displays imperfect pairwise correlation and correlations with the whole world stock market (which is our core allocation) in two ways. First, we display a correlation matrix of daily returns over the past six months:
We moderate inter-day volatility by combining imperfectly correlated equity subclasses
Correlation coefficients between the whole world stock market and the equity overweights, for daily returns in the six months to 1 March 2024
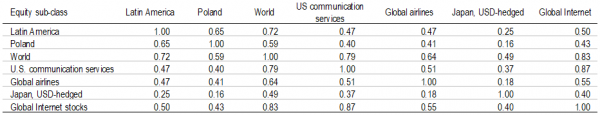
Source: Bloomberg. We use representative ETFs as proxies for asset subclasses.
Second, we display correlations for accumulated monthly returns over the past five years. Note that dollar-hedged Japanese stocks have especially low correlations with the others
Dollar-hedged Japanese stocks have especially low correlations with the others. The table shows correlation coefficients for monthly total returns.
Correlation coefficients between the whole world stock market and the equity subclasses we overweight, for the monthly returns in the five years to 1 March 2024
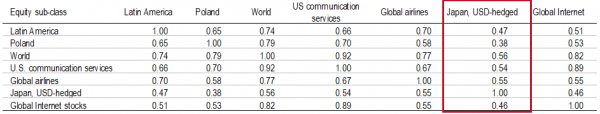
Source: Bloomberg. We use representative ETFs as proxies for asset subclasses.
Lowering volatility at no cost to returns improves a portfolio’s risk-return profile. What the performance charts and the correlation matrices together show is that we were able to go farther than just lower volatility at no cost to returns: by adding our particular choice of overweights to our core allocation, we lowered risk and boosted returns both. This is the best of all worlds.
Liquid alternative assets: no change
In what we call “liquid alts”, a term we use for any publicly traded assets that is not a simple stock or bond, we’ve been underweighting our core real estate position to make room for energy infrastructure Master Limited Partnerships (MLPs). Which is a good thing, since MLPs have massively outperformed rate-stricken real estate.
U.S. energy infrastructure MLPs have produced a 64% total return in the past 26 meses, whereas U.S. real estate trusts have lost 19%
Our core liquid alternative asset allocation (U.S. real estate investment trusts) versus U.S. energy infrastructure MLPs through 1 March 2024, 100 = 1 January 2022
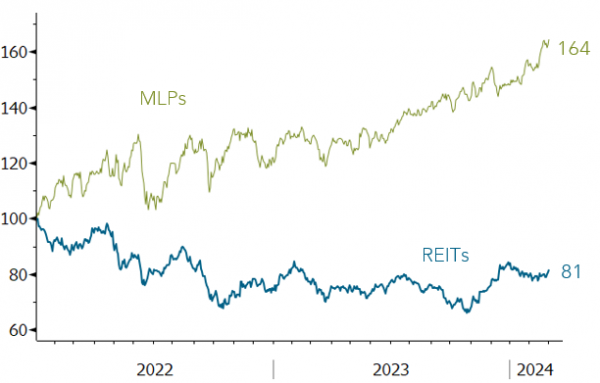
Source: Bloomberg. We use representative ETFs as proxies for asset subclasses.
Note: To compute the percentage changes, subtract 100 from the final index values.
Just as in the case of our equity sub-class selection, energy infrastructure MLPs and real estate investment trusts (REITs) combine nicely to dampen portfolio volatility. Their correlation coefficient for daily returns over the past six months was a mere 0.42. For monthly returns over the past five years, it was a bit higher but still attractive 0.56.